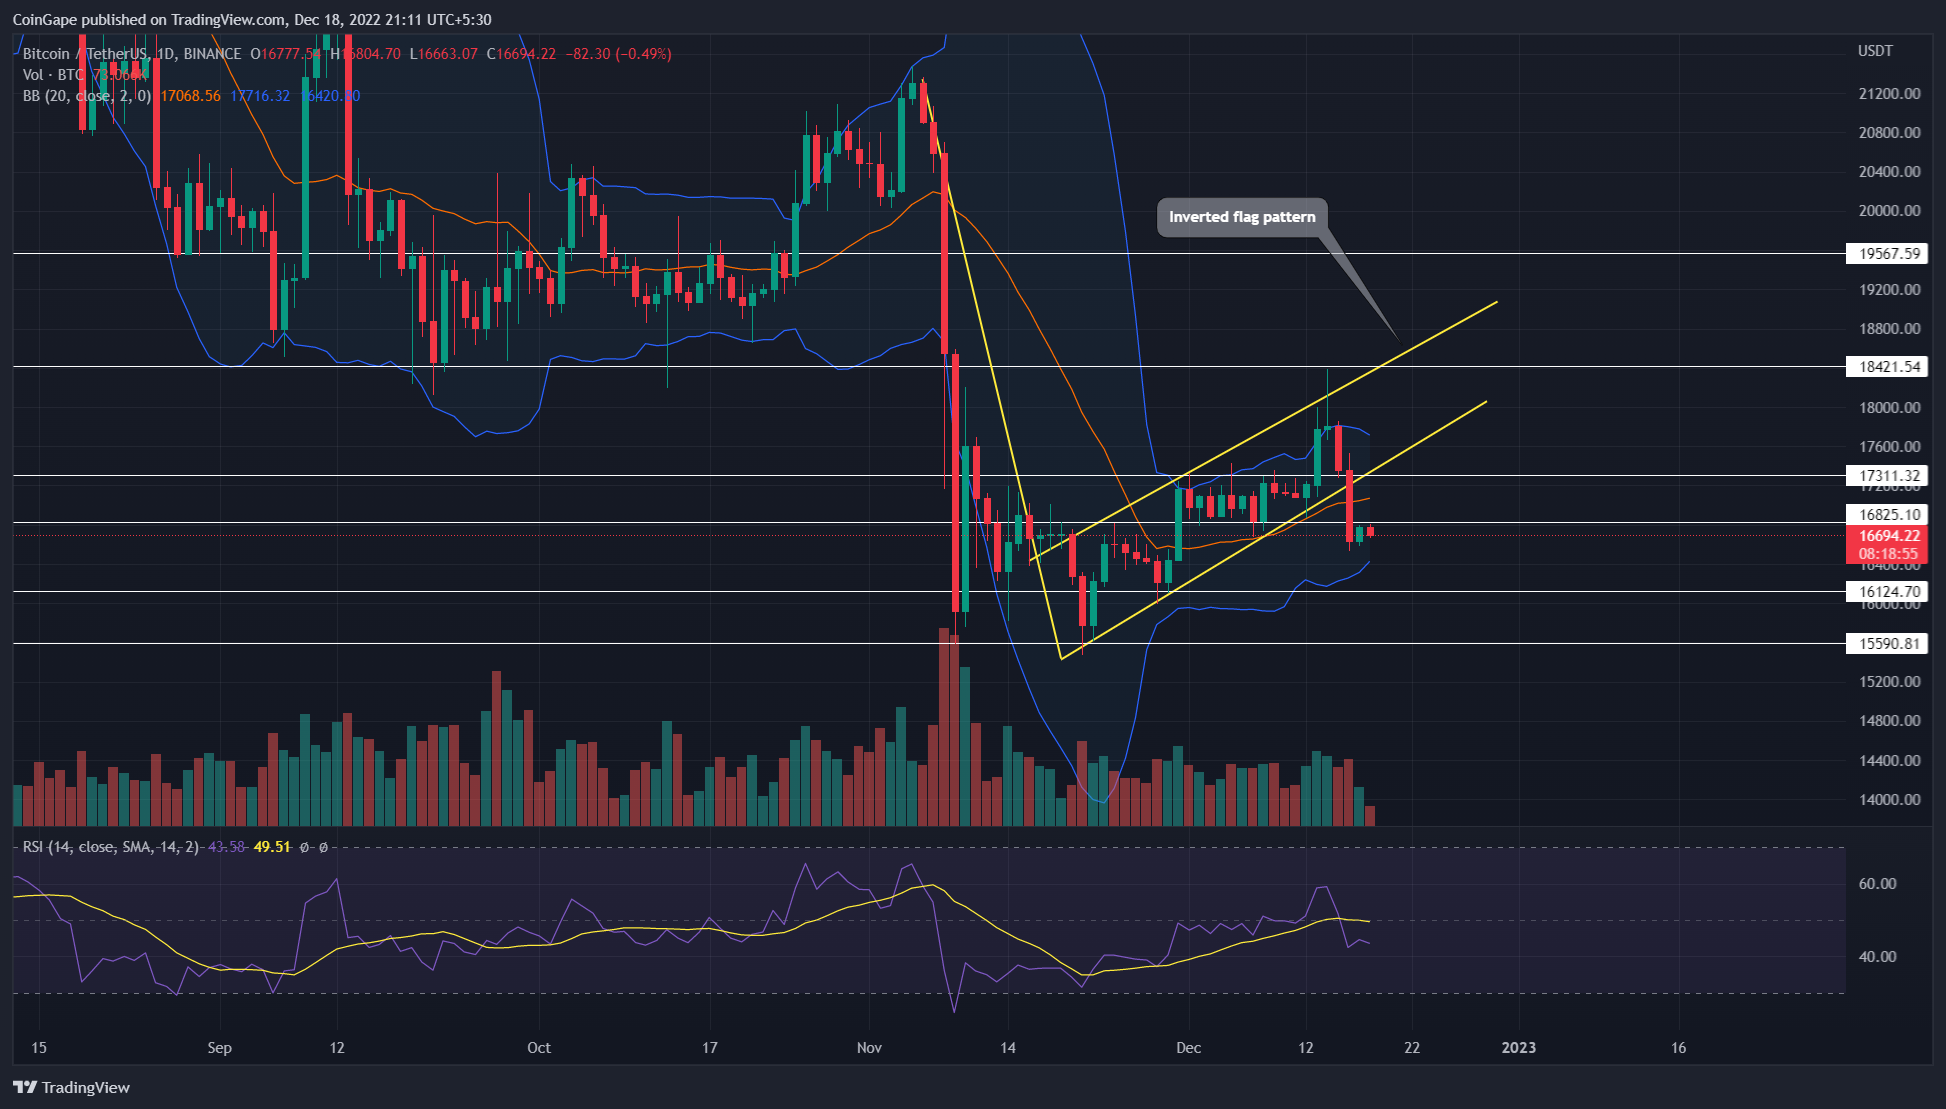
Bitcoin Price Prediction: On December 16, the bitcoin price broke two crucial supports, namely the $16825 and the ascending trend lines, to form an inverted flag pattern. The loss of this support intensifies the ongoing selling pressure in the market, suggesting that the price of BTC could experience a deeper correction in the future support.
Key points
- Bitcoin price set for 6.5% drop following break in reverse flag pattern.
- The slope of the daily RSI is back in the negative zone.
- Bitcoin’s intraday trading volume is $10.3 billion, indicating a 49% loss.
Due to the recent uncertainty surrounding Binance, the crypto-currency exchange, and speculation about the Federal Reserve tightening interest rates, the crypto-currency market has seen significant selling in recent days.
As a result, the price of bitcoin has plummeted by 6.5% over the past four days and is currently trading at the $16696 mark. However, this drop has crossed the support trend line of a bearish continuation pattern called an inverted flag. In theory, this bearish pattern accelerates selling pressure on the market after providing a slight pullback to the upside.
Thus, on December 16, a long red candle broke through the support trend line, indicating the reconstitution of the bearish momentum. Today, the price of BTC is down 0.5%, trying to follow the break of support.
Therefore, if the selling pressure persists, the bitcoin price could fall 6.5% to reach the $15600 support.
However, the $16125 level is an important intermediate support where buyers could try to fight for trend control.
Technical Indicator
RSI RSI: The RSI indicator measuring the speed and magnitude of the recent price movement of the coin reflects the strength of the price behavior. Thus, with the recent decline, the RSI has nosedived below the neutral line, and the 14-SMA overall indicates the increase in the underlying downtrend of the market.
Bollinger Band : the price of the coin moving below the median line of the indicator suggests that sellers are controlling the current price action.
- Intraday levels of the bitcoin price
- Spot price: 16689
- Trend: Bearish
- Volatility : Low
- Resistance levels – $16825 and $17300
- Support levels – $16125 and $15900.
The Best Online Bookmakers June 27 2026
 Bonus€500+ 200 Free spins |
 Bonus€1,000 |
 Bonus€1,000 |
 Siemens issues 1st €60M bond on public blockchain
 Wall Street on a tear: retail sales data drives the rise
 Web3 instant messenger SendingMe raises $12.5M
 FLOKI doubles in value after Elon Musk tweet
 Floki’s listing on Binance soon confirmed, here’s why, now might be the time to invest!